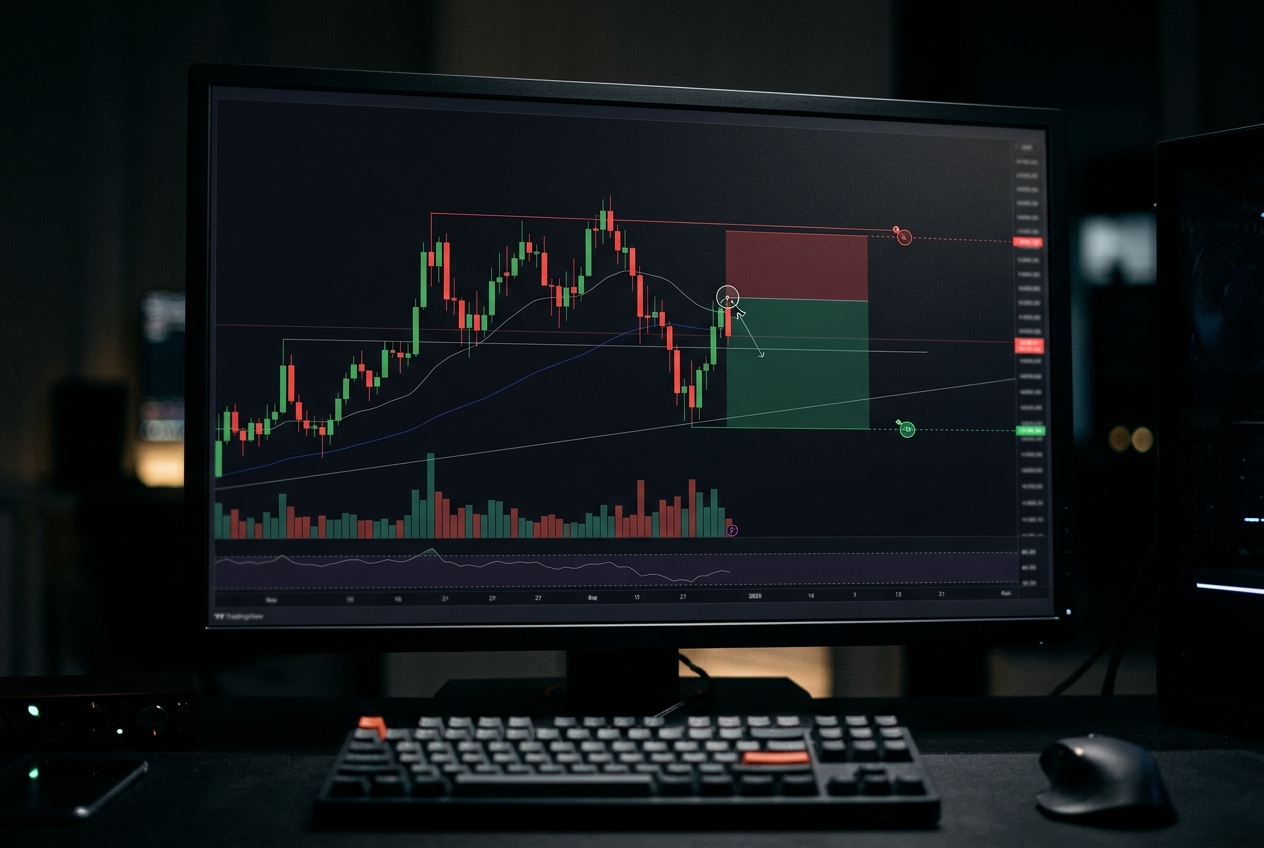
Evaluation challenges are built from rules, and the rules are where most accounts die. Read them like a contract — because they are one.
EVIDENCE LABEL — Rule analysis — no allegation against any named firm
The funded-trading industry sells a seductive equation: pass a test, trade someone else's capital. The test is where the economics live. Understanding the standard rules as a system — not a checklist — explains why evaluation pass rates are low even among skilled traders, and why 'got funded' screenshots are a survivorship filter.
The four rules that do the work
- Daily drawdown: usually measured from the day's starting equity or balance — a single oversized loss breaches it regardless of your month's performance.
- Total (max) drawdown: often trail-from-peak on older rule sets; a static floor on newer ones. The difference changes optimal position size by half or more.
- Consistency rules: caps on the share of profit from a single day — designed to block one-luck trades, punishing genuinely episodic strategies.
- Activity restrictions: news windows and weekend holds, which quietly forbid strategies that need those conditions.
Why the maths is unforgiving
A 5% total drawdown floor with a 1% risk-per-trade plan survives 5 full stop-outs in sequence — probability of five sequential losses at a 40% win rate over any window is well above most traders' intuition. The rule set converts a strategy's normal losing streak into account death. That is not automatically a scam; it is a pricing of risk. But it should be understood as such before paying any fee.
In an evaluation, your first job is not to make money. It is to not violate a contract clause while making money.
METHODOLOGY
Standard published rule families across the industry are modelled as constraints; streak probabilities computed with binomial assumptions stated inline.
LIMITATIONS
Rule sets differ firm by firm and change without notice. This analysis names no firm and should not be read as evaluating any specific operator's conduct.
SOURCES & CITATIONS
DISCLOSURE
This article is independent editorial analysis for information and education. It is not investment advice, a recommendation, or an offer to trade any instrument. Markets involve risk of loss; past or illustrative performance never guarantees future results.